Background:
The biological response, particularly in concentration of phytoplankton, to the physical formation of fronts is well known (e.g. Le Févre 1986; Owen 1981), less information exists on how zooplankton abundances and assemblages are influenced by fronts (but see Graham et al. 1992; Graham and Largier 1997). In order to understand the association of zooplankton with physical water conditions, I have chosen to study zooplankton assemblages in Monterey Bay, California. The large-scale circulation within Monterey Bay is well know (Breaker and Broenkow, 1989; Graham and Largier, 1997), with the predominant flow occurring in a counterclockwise pattern in the northern part of the Bay. Upwelling occurs north of Monterey Bay mainly between March and August, driven by long-shore winds heading equatorward. Colder, upwelled water is transported on the surface by winds southeastward into Monterey Bay (Graham and Largier, 1997). This tongue of colder water may even contact the coastline in the vicinity of Moss Landing Harbor, where it is then circulated northward and then westward along the coast. The surface waters are warmed by solar insolation as it travels along shore. Where the warmed “older” water contacts the colder upwelled water (near Santa Cruz), a strong convergent front is formed. The wide range of temperatures (and other physical variables) in the vicinity of Monterey Bay, should be an ideal setting in which to study any correlation between water characteristics with zooplankton assemblages.
Sampling
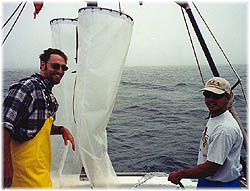 |
| Photo 1 - Lou and Kimo fish for plankton |
|
|
|
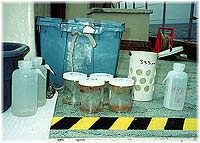
| Photo 2 - Collecting zooplankton on board the R/V Seaworld UCLA |
On 25 April 2000, in conjunction with research at the Monterey Bay Aquarium Research Institute (MBARI), I performed a preliminary study of zooplankton assemblages along the seasonal upwelling front in Monterey Bay aboard the RV Seaworld UCLA. The goal of this expedition was to gather qualitative information on the zooplankton assemblage in the vicinity of the front and compare it to previous work (e.g. Graham and Largier, 1997). From this, I (a) acquired a familiarity with the various zooplankton groups that were common in the Bay, (b) learned the appropriate technique for sampling the front, and (c) based on the experience as a whole, was able to refine a more detailed sampling approach to be undertaken at a future date.
This study coincided with a rather strong upwelling event just north of Davenport, California, where colder, chlorophyll a-rich surface waters were transported southward into the middle of Monterey Bay. Four samples were collected along a transect perpendicular to the convergent front, with one sample collected on the inner margin of the front, one sample 4 km northeast of the front, and two samples collected 4 and 8 km southwest of the front. Latitude, longitude, and time were recorded for each station. Each sample was collected using a paired 333mm plankton net towed vertically from the bottom to the surface. Samples were fixed in 5% formalin and returned to the laboratory for identification and enumeration.
Analysis
|
|
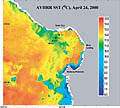
| Figure 1 - AVHRR satellite image of sea surface temperature (SST) with sampling stations. - Click image to enlarge it. |
|
|
|
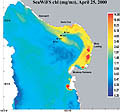
| Figure 2 - SeaWIFS satellite image of chlorophyll-a concentration with sampling stations. - Click image to enlarge it. |
In the laboratory, samples were transferred into 0.1% formalin to prevent degradation of gelatinous zooplankton by alcohol. Sample volumes were measured as per NOAA (1974). Samples were split with a balanced Folsam plankton splitter to a reasonably sized aliquot (<3000 organisms per aliquot), and all animals were identified to the lowest reasonable taxonomic level. After identification and enumeration, non-gelatinous organisms were transferred to 70% ethanol, while gelatinous animals were preserved in 1% formalin-seawater, and voucher specimens were made.
Station locations were plotted on a map, and advanced very high resolution radiometry (AVHRR) and chlorophyll a concentration (SeaWiFS) satellite images were superimposed over the station map (Figures 1 and 2). This served to (a) verify that sampling indeed took place across the front, and (b) provide estimates of surface values of sea surface temperature (SST) and chlorophyll a concentration.
Since the transect was not replicated, and only one sampling effort was made per station, no traditional statistical approach could be take with these preliminary data. Also, despite the fact that the plankton net used was a paired design, each half of the net cannot fish independent of the other. Therefore, the two sides of the plankton net tow were averaged. A simple qualitative comparison of stations was done using a dissimilarity dendrogram to illustrate any large differences in zooplankton assemblage and abundance. Also, Shannon-Wiener species diversity index (H') was generated to make rough comparisons of diversity per station. This index is given as:
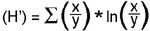
where the diversity index (H') of a given station equals the sum of ratio of the abundance of a species (x) to the total abundance of all species (y), times the natural log of the ratio.
Results Summary
|
|
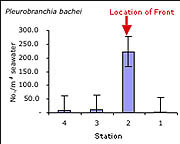
| Figure 3 - Abundance per m3 of comb jellies (Pleurobranchia bachei) |
|
|
|
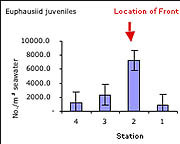
| Figure 4 - Abundance per m3 of juvenile krill (euphausiid) |
|
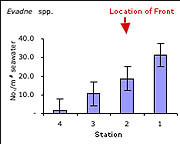 |
| Figure 5 - Abundance per m3 of Evadne spp. (cladocera) |
From the deck of the ship, the convergent front was clearly visible as a narrow zone (10-30m wide) of surface water that appeared differentially disturbed on either side of the boundary. This was likely a result of the wind moving across the two convergent water masses, which had different net directional flows. The Monterey Bay upwelling shadow is formed during periods of intense upwelling, resulting from strong longshore winds north of the Bay. The front was obvious despite southward winds in excess of 15kn and surface swells greater than 1m.
Consistent with data collected previously at the Monterey front (Graham et al., 1992; Graham and Largier, 1997) and at other fronts (e.g. Holligan, 1981; Youssara and Gaudy, 2001), a markedly greater amount of zooplankton per m3 of water was collected on the front, as compared to stations shoreward and seaward. In the case of the ctenophore Pleurobranchia bachei (Figure 3), and all euphausiid juveniles (krill) (Figure 4), the difference in abundance was at least an order of magnitude greater on the front than at any other station. The greater abundance of the predatory ctenophore coincides with the distribution of well-known grazers such as juvenile euphausiids, and the abundance of euphausiids coincides with the greater surface chlorophyll-a concentrations seen in satellite images (2.62 mg/m3 at the front, as opposed to 1.97 mg/m3 at the shoreward station and 0.73 and 0.45 mg/m3 at the two offshore stations) (Figure 2). From these preliminary observations, it is difficult to determine whether or not the observed concentration of the various groups mentioned was (a) due entirely to active transport of organisms to the convergence, (b) a bloom in biomass due to favorable conditions, or (c) active seeking of the nutrient rich conditions at the front. This compelling question has been an important focus recently, particularly for gelatinous macrozooplankton (Graham et al., 2001). Indeed if the observed aggregation were due entirely to physical transport towards the front, then all organisms in the vicinity should have higher densities at the front. However, this was not the case, as certain species exhibited patterns inconsistent with an entirely passive existence. For example, various hydromedusae were common at the front, and were equally abundant at the station 4km shoreward of the front. Also, the cladocera Evadne spp. (Figure 5), all mollusk veligers, and thaliaceans exhibited a trend of increasing numbers in the shoreward directions, irrespective of the location of the front. This distribution suggests that some other mechanism besides passive accumulation, perhaps of a behavioral nature, might result in the observed distribution. It is entirely possible that swimming ability alone in each taxonomic group could account for the differences in distribution around the front (sensu Franks, 1992), though a far more rigorous sampling approach would be necessary to properly address this question.
Literature Cited:
- Breaker, L.C., and W.W. Broenkow, 1994, The circulation of Monterey Bay and related processes, Oceanography and Marine Biology: an Annual Review 32:1-64.
- Graham, W.M., J.G. Field, and D.C. Potts, 1992, Persistent “upwelling shadows” and their influence on zooplankton distributions, Marine Biology 114: 561-570.
- Graham, W.M., and J.L. Largier, 1997, Upwelling shadows as nearshore retention sites: the example of northern Monterey Bay, Continental Shelf Research 17(5): 509-532.
- Graham, W. M., F. Pagés, W. M. Hamner, 2001, A physical context for gelatinous zooplankton aggregations: a review., Hydrobiologia 451: 199-212.
- Franks, P. J. S., 1992, Sink or swim: accumulation of biomass at fronts., Marine Ecology Progress Series 82: 1-12.
- Holligan, P. M., 1981, Biological implications of fronts on the Northwest European Continent Shelf., Philosophical Transactions of the Royal Society of London, Series A, Mathematical and Physical Science 302(1472): 547-562.
- Le Févre, J., 1986, Aspects of the biology of frontal systems, Advances in Marine Biology 23: 163-299.
- Owen, R.W., 1981, Fronts and eddies in the sea: Mechanisms, interactions and biological effects, In: Analysis of Marine Ecosystems, A.R. Longhurst (ed.), Academic Press.
- Youssara, F., and R. Gaudy, 2001, Variations of zooplankton in the frontal area of the Alboran sea (Mediterranean sea) in winter 1997., Oceanologica Acta 24(4): 361-376.
|